
Bitcoin has been on a wild ride this week, with dramatic price swings that captured the attention of both seasoned investors and curious newcomers. From hitting new all-time highs to sharp corrections, this rollercoaster week highlights the complexities of the cryptocurrency market. In this post, we’ll analyze the economic factors, market trends, and key data points to help investors navigate Bitcoin’s volatility.
Weekly Price Highlights
This week, Bitcoin reached a record high of $108,000 before experiencing a sharp correction to a low of $91,000, marking a 15.74% decline. Despite these fluctuations, Bitcoin continues to be a focal point for traders, driven by both macroeconomic trends and institutional activity.
Key Insights from the Candlestick Chart
The candlestick chart for Bitcoin this week provides critical insights:
- Sharp Decline Post-High: The price peaked at $108,000, fueled by institutional buying and bullish sentiment. However, profit-taking by large investors (whales) led to a rapid correction.
- Long Wicks Indicating Volatility: The chart shows frequent long wicks, reflecting intraday price swings and market uncertainty.
- Narrowing Closing Gaps: By the end of the week, the gaps between opening and closing prices narrowed, suggesting reduced momentum and potential stabilization.
Bitcoin Price Volatility: December 2024
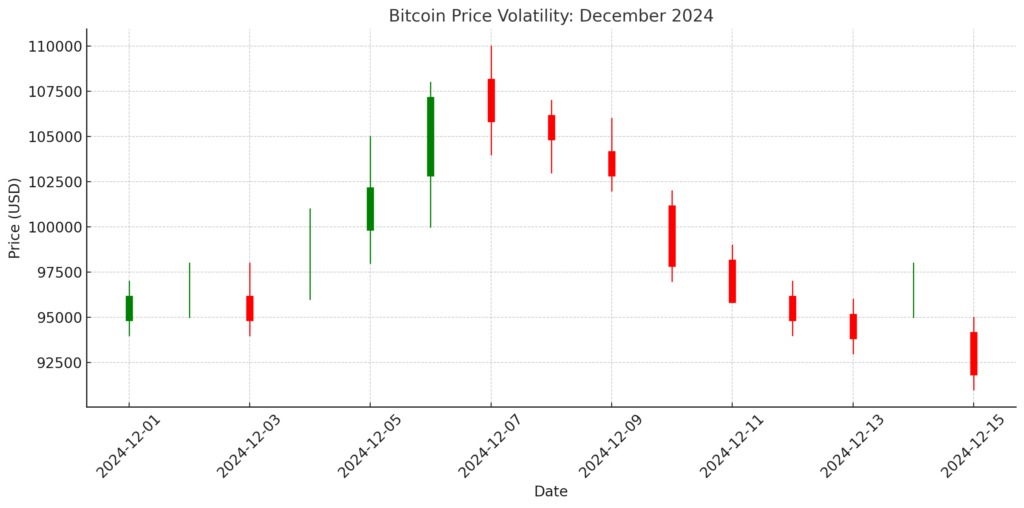
The candlestick chart highlights Bitcoin’s price fluctuations during the week, showing its inherent volatility.
Economic Factors Driving Bitcoin’s Volatility
Several key economic factors contributed to Bitcoin’s rollercoaster week:
- Federal Reserve Policies: Speculation about potential interest rate hikes in 2025 created uncertainty, reducing risk appetite for speculative assets like Bitcoin. Learn more about the Federal Reserve’s impact.
- Institutional Activity: Large trades by companies like MicroStrategy have amplified price swings, reflecting the influence of institutional players. Read about MicroStrategy’s Bitcoin strategy.
- Macroeconomic Trends: A strengthening U.S. dollar index placed downward pressure on Bitcoin, which often inversely correlates with the dollar.
Mathematical Analysis of Volatility
Using volatility metrics, we can quantify Bitcoin’s dramatic price movements this week:
- Average Daily Volatility: Approximately 7.15%, calculated as the average of daily high-low ranges.
- Projected Annualized Volatility: ~51.96%, consistent with Bitcoin’s historical patterns. View detailed volatility projections here.
These metrics underscore Bitcoin’s nature as a high-risk, high-reward asset class, requiring careful consideration by investors.
Investor Takeaways
For those navigating Bitcoin’s volatile markets, here are some key recommendations:
- Short-Term Investors: Use risk management strategies like stop-loss orders to limit potential losses. Avoid emotional decision-making driven by FOMO or panic selling.
- Long-Term Investors: View corrections as potential entry points and consider dollar-cost averaging (DCA) to mitigate short-term price swings.
- Diversification: Reduce exposure to Bitcoin by diversifying into less volatile assets to balance overall portfolio risk.
Conclusion
Bitcoin’s rollercoaster week highlights the complexities of the cryptocurrency market, driven by a mix of macroeconomic factors, institutional activity, and investor sentiment. While short-term volatility may deter some, Bitcoin’s long-term potential continues to attract interest from both retail and institutional players. By staying informed and employing robust risk management strategies, investors can navigate the challenges of this dynamic market.
Stay informed about the latest Bitcoin trends and market insights. Visit BitcoinMarket.ai for daily updates and expert analysis.